All countries of the world listed from A-Z:

or choose from the countries per continent below:


 |  |  |  |  |  |
 | ESTONIA [Eesti]general data of the country |
| General useful information |
| Note: some data are of constant value, while other are due to changes, fluctuations etc. |
| Nation and population |
| official name (short form): Eesti |
| country code ISO: EE //; - FIPS: EN |
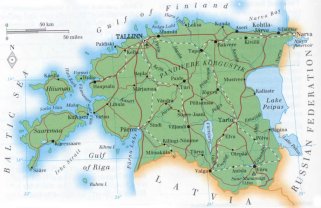
| location: Eastern Europe |
| time zone: + 2 UT* [*= applying daylight saving time] |
| surface (land) area: 45227 sq.km = 17462 sq.mi //; - area incl. inland waters: sq.km = sq.mi |
| geographical position in extreme co-ordinates: North: 60° N / South: 58° N / East: 28° E / West: 22° E |
| borders (land): Russian Federation, Latvia |
| borders (coastline): Baltic Sea, Gulf of Finland |
| climate: cool maritime |
| Government |
| independent since: [1918-1940] ; 1990-05-08 ; 1991-08-20 |
| type of government: republic |
| capital: Tallinn |
| administrative division: maakond (15) ; linna [city] (39) ; city without municipal status (8) ; rural municipality (202) |
| Population |
| population according to the last two censuses: (1989): 1572,916 //; - (2000): 1370,500 |
| estimated total population of midyear 2000: 1369,000 ; 2001: 1366,723 ; 2002: 1361,200 ; 2003: 1356,000 |
| population density: 30 per sq.km = 77 per sq.mi |
| population growth: -5% //; - doubling time: not applicable; declining population |
| birth rate: 9 per 1000 |
| death rate: 14 per 1000 |
| fertility rate: 2 children per female |
| maternal mortality: per 100,000 |
| infant mortality (1-4 years): 14,5 per 1000 |
| life expectancy: 70 years (male: 64; female: 76) |
| age breakdown: 0-14 years: 23% //; - 15-59 years: 60% //; - 60+ years: 17% |
| urbanisation: 69% //; - urbanisation growth: % |
| percentage of urban population in the greatest city: % |
| Ethnic composition, language, religion |
| ethnic groups: Estonian 65%; Russian 28%; Ukrainian 2,5%; Belarusian 1,5%; Finnish 1% |
| languages: Estonian, Russian |
| religious affiliation: Evangelical Lutheran 67%; Russian Orthodox 19%; Baptist 14% |
| Health |
| daily food intake: 3058 calories per capita |
| population with access to safe water: % |
| people per physician: 217 |
| people per hospital bed: |
| Education, literacy |
| school enrolment: primary education 6-11 years: 90% |
| school enrolment: secondary education: 45% |
| school enrolment: tertiary education 20-24 years: 14% |
| adult literacy: 99,7% (male: %; female: %) |
| Economy and infrastructure |
| Economy and trade |
| currency: Kroon [EEK] = 100 senti |
| annual inflation rate: 53% |
| population below poverty line: 9% |
| Gross Domestic Product: USD 2860 per capita |
| GNI USD 3580 per capita //; - [ppp: 9340] |
| GDP growth: 1% |
| income: USD 3830 per capita |
| import: USD 3197 per capita //; - export: USD 2074 per capita |
| trade: USD 850 per capita //; - or 150% of GDP |
| trade partners: RU BL UR LV LT FI SE DE NL |
| human development index: 0,812 //; - position of the country in the world no.: 44 |
| female labour force: 49% |
| unemployment: 5% |
| tourism: 1,1 million |
| Economic activities in agriculture, fisheries, industry, mining, services, energy |
| land use: arable land: 22% //; - grass land: 25% //; - wooded area: 43% //; - arid land and desert: % |
| agriculture: labour force: 12% //; - part of agriculture in GDP: 26% |
| agricultural products: flax, rye, hay, potatoes, barley, fruits, vegetables |
| livestock (1000s): asses: / cattle: 267 / goats: / horses: 4 / pigs: 286 / poultry: 2500 / sheep: 28 |
| fish catch: 111793 - 123873 metric tonnes |
| industry: labour force: 32% //; - part of industry in GDP: 56% |
| industrial products: food products, chemicals, textiles, shipbuilding, electric motors, cement |
| mining products: oil shale, phosphorite, peat |
| CO2 emission per capita: 12,1 |
| services: labour force: 57% //; - part of services in GDP: 18% |
| energy use (kg per capita): 3286 |
| electricity use (per capita): 3435 |
| annual water use (per capita): 2097 |
| Traffic, communication |
| road network: 14922 - 16430 km //; - of which paved: 54% //; - of which are motorways: 64 km |
| vehicles: 125 per 1000 |
| railways: 1024 km //; - railways passenger/km: 421 |
| navigable inland waterways: 500 km |
| ownership telephone: 277 - 357 per 1000 |
| ownership radio receivers: 698 per 1000 |
| ownership tv-sets: 411 - 480 per 1000 |
| newspaper circulation: 242 per 1000 |
| persons per post office: 2550 |
| personal computers: 153 per 1000 |
| Some physical landmarks |
| mountains: Suur Munamägi 318 m |
| lowest point: sea level |
| lakes (natural): Peipsi järv (`'Cudskoje, Peipus) [total 3555 sq.km, of which in Estonia 1529], Vörtsjärv 271 |
| lakes (artificial reservoirs): Narva Reservoir [total 191, in Estonia 38] |
| lakes (deepest): unknown |
| rivers: Vohandu 162 km, Pärnu 144, Poltsamaa 135, Kasari, Narva |
| canals: none |
| waterfalls: unknown |
| caves: longest system: unknown / deepest: |
| islands: Saaremaa (Ösel) 2671 sq.km, Hiiumaa (Dagö) 989 , Muhu 198, Vormsi ; in total 1521 islands |
| deserts: none |
| other natural features: |
| Additional remarks, especially on the statistical information |
| other important features: |
| apart from physical landmarks most of the above figures are changeable, in most cases they date from the 1990's |
| primary sources used for the general information: |
| BB CA EV PW WA WB WR, and some national statistical yearbooks |
| particulars concerning population data: |
 To the page containing the population growth statistics of the country
 To the page containing the historical population growth statistics of the provinces
 To the page containing urban historical population statistics
 Back to the homepage of this website: POPULATION STATISTICS
Internet website: Internet website:Latest modification of this page on 2004-02-08 by Jan Lahmeyer
© "populstat" site: Jan Lahmeyer