All countries of the world listed from A-Z:

or choose from the countries per continent below:


 |  |  |  |  |  |
 | CANADAgeneral data of the country |
| General useful information |
| Note: some data are of constant value, while other are due to changes, fluctuations etc. |
| Nation and population |
| official name (short form): Canada |
| country code ISO: CA [CAN] //; - FIPS: CA |
| location: North America |
| time zone: -3:30 / -8 UT* [*= applying daylight saving time] |
| surface (land) area: 9220970 sq.km = 3560216 sq.mi //; - area incl. inland waters: 9976140 sq.km = 3851788 sq.mi |
| geographical position in extreme co-ordinates: North: 83° N / South: 42° N / East: 53° W / West: 141° W |
| borders (land): United States of America |
| borders (coastline): Pacific Ocean, Arctic Ocean, Atlantic Ocean |
| climate: varies from polar (n) to cool temperate (s) |
| Government |
| independent since: 1867-07-01 ; 1949 ; 1982 (last change of constitution) |
| type of government: constitutional monarchy (United Kingdom) |
| capital: Ottawa |
| administrative division: province (10) + territory (3) |
| Population |
| population according to the last two censuses (1991): 27296,900 //; - (2001): 30007,094 |
| total population according to the estimate of midyear 2000: 31281,092 / or: 30750,000; 2002: 31362,000 |
| population density: 3 per sq.km = 8 per sq.mi |
| population growth: 1,2% //; - doubling time: ca 35 years |
| birth rate: 11- 13 per 1000 |
| death rate: 7 - 8 per 1000 |
| fertility rate: 2 children per female |
| maternal mortality: 3 per 100,000 |
| infant mortality (in the first year of life): 7 per 1000 |
| infant mortality (from 1st - 4th year of life): 5 per 1000 |
| life expectancy: 79 years (male: 76; female: 83) |
| age breakdown: 0-14 years: 21% //; - 15-59 years: 63% //; - 60+ years: 16% |
| urbanisation: 77% //; - urbanisation growth: 1,7% |
| percentage of urban population in the greatest city: 18% |
| Ethnic composition, language, religion |
| ethnic groups: British origin 40%; French origin 27%; other European 20%; Asiatic 2%; Amerindian, Iniut 2% |
| languages: English, French (both official); Inuktitut |
| religious affiliation: Roman Catholic 45%; United Church 12%; Anglican 8%; other (Muslim, Jewish) 22%; non religious 13% |
| Health |
| daily food intake: 3167 calories per capita |
| population with access to safe water: 99% |
| people per physician: 450 - 538 |
| people per hospital bed: 177 |
| Education, literacy |
| school enrolment: primary education 6-11 years: 100% |
| school enrolment: secondary education: 93% |
| school enrolment: tertiary education 20-24 years: 62% |
| adult literacy: 99% (male: %; female: %) |
| Economy and infrastructure |
| Economy and trade |
| currency: Canadian dollar = 100 cents |
| annual inflation rate: 1,4% |
| population below poverty line: % |
| Gross Domestic Product: USD 21000 per capita |
| GNI USD 21130 - 22390 per capita //; - [ppp: 27170 - 28930] |
| GDP growth: 2% |
| income: USD 19380 - 21620 per capita |
| import: USD 54800 per capita //; - export: USD 68400 per capita |
| trade: USD 9355 per capita //; - or 76% of GDP |
| trade partners: US GB JP EU CN MX |
| human development index: 0,936 //; - position of the country in the world no.: 3 |
| female labour force: 46% |
| unemployment: 7 - 8% |
| tourism: 20 - 40 million |
| Economic activities in agriculture, fisheries, industry, mining, services, energy |
| land use: arable land: 5% //; - grass land: 3% //; - wooded area: 39% //; - arid land and desert: 45% [arctic] |
| agriculture: labour force: 3% [PG: 5%] //; - part of agriculture in GDP: 3% |
| agricultural products: fish, furs, timber, wheat, grains, oilseed, tobacco, fruit, vegetables |
| livestock (million): cattle: 12,8 - 13,7 / goats: 0,03 / horses: 0,4 / pigs: 12,2 - 14,4 / poultry: 169 / sheep: 0,7 / turkeys: 5,9 |
| fish catch: 1021916 - 1120000 metric tonnes |
| industry: labour force: 19% [PG: 21%] //; - part of industry in GDP: 21% |
| industrial products: transport equipment, food, paper, metals, electronics, rubber, plastics, chemicals |
| mining products: coal, cobalt, copper, gold, iron ore, lead, molybdenum, gas, oil, nickel, platinum, zinc, uranium, asbestos, potash, gypsum, silver |
| CO2 emission per capita: 15,4 |
| services: labour force: 77% [PG: 72%] //; - part of services in GDP: 76% |
| energy use (kg per capita): 7929 |
| electricity use (per capita): 15260 |
| annual water use (per capita): 1602 |
| Traffic, communication |
| road network: 1021000 km //; - of which paved: 35% [497306] //; - of which are motorways: 16571 - 16900 km |
| vehicles: 500 per 1000 // international license plate: CDN |
| railways: 12754 km? ; or: 71104 - 194000 km //; - railways passenger/km: 1430 |
| navigable inland waterways: 3000 - 3770 km |
| ownership telephone: 590 - 676 per 1000 // international dialling code: +1 |
| ownership radio receivers: 803 - 1078 per 1000 |
| ownership tv-sets: 647 - 717 per 1000 |
| newspaper circulation: 189 per 1000 |
| persons per post office: 1590 |
| personal computers: 390 per 1000 |
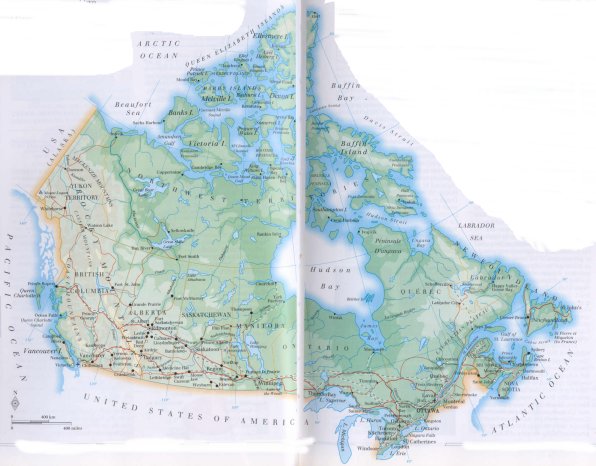
| Some physical landmarks |
| mountains: Mount Logan 5959 m; Mt. Saint Elias 5489; Mt. Lucania 5226; King Pk 5173, Mt. Steele 5067, Mt. Robson 3954 |
| lowest point: sea level |
| lakes (natural): Great Bear Lake, Great Slave Lake, Lake Winnipeg, Lake Superior - Huron - Erie - Ontario |
| lakes (artificial reservoirs): Nechako Reservoir |
| lakes (deepest): unknown |
| rivers: Mackenzie, Fraser, Nelson, St. Lawrence, Yukon, Columbia, Ottawa, Peace, Athabasca, Liard, Saskatchewan, Assiniboine, Churchill |
| canals: Welland Canal |
| waterfalls: Della 440 m, Takakkaw 366, Panther 183 |
| caves: longest system: unknown / deepest: |
| islands: Baffin -, Ellesmere -, Victoria -, Devon -, Melville -, Banks Isl., Newfoundland, Axel Heiberg, Southampton, Prince of Wales, Vancouver |
| deserts: none in the sense of warm arid areas, however, the Arctic area could be described as a cold desert |
| other natural features: |
| Additional remarks, especially on the statistical information |
| other important features: |
| apart from physical landmarks most of the above figures are changeable, in most cases they date from the 1990's |
| primary sources used for the general information: |
| BB CA DK EV FW PW WA WB WR, and some - local national or international - statistical yearbooks |
| particulars concerning population data: |
 To the page containing the population growth statistics of the country
 To the page containing the historical population growth statistics of the provinces
 To the page containing urban historical population statistics
 Back to the homepage of this website: POPULATION STATISTICS
Internet website: Internet website:Latest modification of this page on 2004-12-24 by Jan Lahmeyer
© "Populstat" website: Jan Lahmeyer