All countries of the world listed from A-Z:

or choose from the countries per continent below:


 |  |  |  |  |  |
 | BURUNDIgeneral data of the country |
| General useful information |
| Note: some data are of constant value, while other are due to changes, fluctuations etc. |
| Nation and population |
| official name (short form): Burundi |
| country code ISO: BI [BDI] //; - FIPS: BY |
| location: Central Africa |
| time zone: +2 UT |
| surface (land) area: 25650 sq.km = 9903 sq.mi //; - area incl. inland waters: 27834 sq.km = 10747 sq.mi |
| geographical position in extreme co-ordinates: North: 2° S / South: 4° S / East: 31° E / West: 29° E |
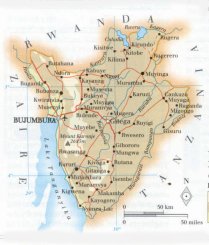
| borders (land): Rwanda, Tanzania, Congo Kinshasa |
| borders (coastline): no sea border, Lake Tanganyika |
| climate: tropical, though temperated by mountainous location |
| Government |
| independent since: 1962-07-01 |
| type of government: republic |
| capital: Bujumbura |
| administrative division: province (15) |
| Population |
| population according to the latest - or last two - censuses (1990): 5292,793 [or: 5139,100] |
| total population according to the estimate of midyear 2000: 6054,714 //; or: 6807,000; 2001: 6840,000 / ; 2002: 7071,000 |
| population density: 244 per sq.km = 633 per sq.mi |
| population growth: 2,9% //; - doubling time: 25 years |
| birth rate: 40 - 47 per 1000 |
| death rate: 15 - 16 per 1000 |
| fertility rate: 7 children per female |
| maternal mortality: per 100,000 |
| infant mortality (in the first year of life): 208 per 1000 |
| infant mortality (from 1st - 4th year of life): 101 - 123 per 1000 |
| life expectancy: 46 - 49 years (male: 45 - 48; female: 47 - 51) [FW 2002: 42] |
| age breakdown: 0-14 years: 45% //; - 15-59 years: 50% //; - 60+ years: 5% |
| urbanisation: 7 - 9% //; - urbanisation growth: 2,5% |
| percentage of urban population in the greatest city: ca 50% |
| Ethnic composition, language, religion |
| ethnic groups: Hutu 85%; Tutsi 14%; Twa 1% |
| languages: French, kiRundi, Swahili |
| religious affiliation: Roman Catholic 62%; traditional beliefs 16%; Protestant 5%; non religious 17% |
| Health |
| daily food intake: 1578 calories per capita |
| population with access to safe water: 52% [FW 2000: 78%] |
| people per physician: 21000 - 100000 |
| people per hospital bed: |
| Education, literacy |
| school enrolment: primary education 6-11 years: 55% |
| school enrolment: secondary education: 8% |
| school enrolment: tertiary education 20-24 years: % |
| adult literacy: 35% (male: 50%; female: 23%) [source DK: 49% ; FW 2000: m 56% / f 40%] |
| Economy and infrastructure |
| Economy and trade |
| currency: Burundi franc (F.Bu.) = 100 centimes |
| annual inflation rate: 12% |
| population below poverty line: 36% [FW: 58%] |
| Gross Domestic Product: USD 189 per capita |
| GNI USD 100 - 110 per capita //; - [ppp: 580 - 630] |
| GDP growth: -5% |
| income: USD 160 - 210 per capita |
| import: USD 205 per capita //; - export: USD 69 per capita |
| trade: USD 60 per capita //; - or 29% of GDP |
| trade partners: DE BE FI JP FR IR GB ZM NL KE RW TZ SA |
| human development index: 0,309 //; - position of the country in the world no.: 160 |
| female labour force: 49% |
| unemployment: % [large amount] |
| tourism: 0,03 million |
| Economic activities in agriculture, fisheries, industry, mining, services, energy |
| land use: arable land: 52% //; - grass land: 36% //; - wooded area: 3% //; - arid land and desert: % |
| agriculture: labour force: 93% //; - part of agriculture in GDP: 55% |
| agricultural products: coffee, cotton, tea |
| livestock (1000s): asses: / cattle: 315 - 400 / goats: 550 - 920 / pigs: 50 - 80 / poultry: 4300 / sheep: 120 - 330 |
| fish catch: 9199 - 10055 metric tonnes |
| industry: labour force: 2% //; - part of industry in GDP: 16% |
| industrial products: food processing, light consumer goods |
| mining products: gold, tungsten, nickel, vanadium, oil, uranium |
| CO2 emission per capita: 0,0 |
| services: labour force: 6% //; - part of services in GDP: 29% |
| energy use (kg per capita): 23 |
| electricity use (per capita): |
| annual water use (per capita): 20 |
| Traffic, communication |
| road network: 6285 [or: 14480] km //; - of which paved: 7% [1028] //; - of which are motorways: 0 km |
| vehicles: 3 per 1000 // international license plate: RU |
| railways: 0 km //; - railways passenger/km: - |
| navigable inland waterways: 0 km (shipping is only possible on Lake Tanganyika) |
| ownership telephone: 3 per 1000 // international dialling code: +257 |
| ownership radio receivers: 47 - 71 per 1000 |
| ownership tv-sets: 7 per 1000 |
| newspaper circulation: 3 per 1000 |
| persons per post office: 219000 |
| personal computers: per 1000 |
| Some physical landmarks |
| mountains: Karonje 2685 m |
| lowest point: Lake Tanganyika 773 m |
| lakes (natural): Lake Tanganyika, Cohoha, Rweru |
| lakes (artificial reservoirs): unknown |
| lakes (deepest): Lake Tanganyika 1435 m |
| rivers: several small rivers, most of them flowing into Lake Tanganyika |
| canals: none |
| waterfalls: unknown |
| caves: longest system: unknown / deepest: |
| islands: none |
| deserts: none |
| other natural features: |
| Additional remarks, especially on the statistical information |
| other important features: |
| apart from physical landmarks most of the above figures are changeable, in most cases they date from the 1990's |
| primary sources used for the general information: |
| BB CA DK EV FW PW WA WB WR, and some - local national or international - statistical yearbooks |
| particulars concerning population data: |
 To the page containing the population growth statistics of the country
 To the page containing the historical population growth statistics of the provinces
 To the page containing urban historical population statistics
 Back to the homepage of this website: POPULATION STATISTICS
Latest modification of this page on 2004-12-21 by Jan Lahmeyer
© "Populstat" website: Jan Lahmeyer