All countries of the world listed from A-Z:

or choose from the countries per continent below:


 |  |  |  |  |  |
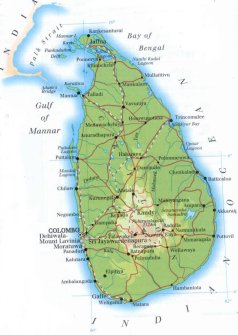 | SRI LANKAgeneral data of the country |
| General useful information |
| Note: some data are of constant value, while other are due to changes, fluctuations etc. |
| Nation and population |
| official name (short form): Srî Lanka ; Ilankai |
| country code ISO: LK //; - FIPS: CE |
| location: South Asia |
| time zone: +5:30 UT |
| surface (land) area: 65610 sq.km = 25332 sq.mi //; - area incl. inland waters: sq.km = sq.mi |
| geographical position in extreme co-ordinates: North: 10° N / South: 6° N / East: 82° E / West: 80° E |
| borders (land): none |
| borders (coastline): Indian Ocean |
| climate: tropical, humid, monsoon |
| Government |
| independent since: 1948-02-04 |
| type of government: republic |
| capital: Colombo (administrative), Sri Jayewardenepura Kotte (legislative) |
| administrative division: province (9) into district (25) |
| Population |
| population according to the last two censuses: (1981): 14848,364 /-; (2001:) 19410,000 |
| total population according to the estimate of midyear 2000: 19238,575; or: 19359,000 / -; 2001: 19408,635 |
| population density: 294 per sq.km = 762 per sq.mi |
| population growth: 1,4% //; - doubling time: 52 years |
| birth rate: 17 - 20 per 1000 |
| death rate: 6 per 1000 |
| fertility rate: 2 children per female |
| maternal mortality: 60 per 100,000 |
| infant mortality (1-4 years): 24 per 1000 |
| life expectancy: 73 years (male: 71; female: 75) |
| age breakdown: 0-14 years: 33% //; - 15-59 years: 59% //; - 60+ years: 8% |
| urbanisation: 24% //; - urbanisation growth: 4% |
| percentage of urban population in the greatest city: 16% |
| Ethnic composition, language, religion |
| ethnic groups: Sinhalese 73,9%; Tamil 12,7%; Sri Lankan Moor 7,1%; Indian Tamil 5,5%; Burgher 0,3%; Malayan 0,3% |
| languages: Sinhala, Tamil (both official); English |
| religious affiliation: Buddhist 69,3%; Hindu 15,5%; Muslim 7,5%; Christian (mainly Roman Catholic) 6,9%; other: 0,8% |
| Health |
| daily food intake: 2314 calories per capita |
| population with access to safe water: 20, or 83% |
| people per physician: 2740 |
| people per hospital bed: 355 |
| Education, literacy |
| school enrolment: primary education 6-11 years: 98% |
| school enrolment: secondary education: 53% |
| school enrolment: tertiary education 20-24 years: 1% |
| adult literacy: 87% (male: 90%; female: 84%) [later as total figure found: 92%] |
| Economy and infrastructure |
| Economy and trade |
| currency: Sri Lanka rupee = 100 cents |
| annual inflation rate: 9% |
| population below poverty line: 25% |
| Gross Domestic Product: USD 640 per capita |
| GNI USD 850 per capita //; - [ppp: 3460] |
| GDP growth: 4% |
| income: USD 500 per capita |
| import: USD 2833 per capita //; - export: USD 2391 per capita |
| trade: USD 293 per capita //; - or 73% of GDP |
| trade partners: JP IN SK US GB DE BE NL FR |
| human development index: 0,735 //; - position of the country in the world no.: 81 |
| female labour force: 37% |
| unemployment: 8% |
| tourism: 0,4 million |
| Economic activities in agriculture, fisheries, industry, mining, services, energy |
| land use: arable land: 29% //; - grass land: 7% //; - wooded area: 32% //; - arid land and desert: % |
| agriculture: labour force: 43% //; - part of agriculture in GDP: 27% |
| agricultural products: tea, rice, coconuts, sugarcane, cassava, cattle, rubber, timber |
| livestock (1000s): buffalo 694 / cattle: 1557 / goats: 495 / horses: 1 / pigs: 71 / poultry: 10200 / sheep: 11 |
| fish catch: 247000 - 271595 metric tonnes |
| industry: labour force: 12% //; - part of industry in GDP: 25% |
| industrial products: food manufacturing & processing, textiles, clothing, oil refining |
| mining products: quartz stone, limestone, titanium, gemstones, petroleum, graphite, phosphates |
| CO2 emission per capita: 0,4 |
| services: labour force: 46% //; - part of services in GDP: 48% |
| energy use (kg per capita): 406 |
| electricity use (per capita): 255 |
| annual water use (per capita): 503 |
| Traffic, communication |
| road network: 102600 km //; - of which paved: 11% //; - of which are motorways: 0 km |
| vehicles: 10 per 1000 |
| railways: 1447, or 1493 km //; - railways passenger/km: 3264 |
| navigable inland waterways: 430 km |
| ownership telephone: 11 - 36 per 1000 |
| ownership radio receivers: 182 - 210 per 1000 |
| ownership tv-sets: 66 - 92 per 1000 |
| newspaper circulation: 25 per 1000 |
| persons per post office: 4440 |
| personal computers: 7 per 1000 |
| Some physical landmarks |
| mountains: Pidurutalagala 2524 m, Kirigalpota 2395, Totapolakanda 2357, Kudahagala 2320, Sri Pada (Adam's Peak) 2243, Kikiimana 2240 |
| lowest point: sea level |
| lakes (natural): Senanayake Samudra, Nanthi Kadal, and lots of other small lakes |
| lakes (artificial reservoirs): Uda Walawe Reservoir, and possibly some more |
| lakes (deepest): unknown |
| rivers: Mahaweli Ganga 335 km, Aruvi Aru 164, Kala Oya 148, Kelani 145 |
| canals: none, or unknown |
| waterfalls: Bambarakanda 263 m |
| caves: longest system: none, or unknown / deepest: |
| islands: Karaitiv, Mannar, Kayts, Punkudutivi, Delft |
| deserts: none |
| other natural features: |
| Additional remarks, especially on the statistical information |
| other important features: |
| apart from physical landmarks most of the above figures are changeable, in most cases they date from the 1990's |
| primary sources used for the general information: |
| BB CA EV PW WA WB WR, and some national statistical yearbooks |
| particulars concerning population data: |
| due to the unstable political situation the census of 2001 is not held in the Northern-Northeastern districts |
 To the page containing the population growth statistics of the country
 To the page containing the historical population growth statistics of the provinces
 To the page containing urban historical population statistics
 Back to the homepage of this website: POPULATION STATISTICS
Internet website:Latest modification of this page on 2004-03-07 by Jan Lahmeyer
© "populstat" site: Jan Lahmeyer